• Home
  • Categories
  • News
  • Community
EN
EN
Home
CategoriesNewsGlossaryCommunity
Contact Us
Social Media
Region
🌏International
Region
🌏International
Contact
Home
/
News
/
4 Effective Trading Indicators

4 Effective Trading Indicators

TraderKnows IndiaTraderKnows India
2024-08-27
Summary:One of the most critical tools in a trader’s arsenal is the use of trading indicators. These indicators provide valuable insights into the market.

4 Effective Trading Indicators Every Trader Should Know:

Trading in financial markets, whether in stocks, forex, or commodities, requires a comprehensive strategy that includes understanding market movements, identifying trends, and making informed decisions. One of the most critical tools in a trader’s arsenal is the use of trading indicators. These indicators provide valuable insights into market conditions and help traders determine when to enter or exit a trade. Here are four effective trading indicators that every trader should know.

1. Moving Averages (MA)

r2.jpeg

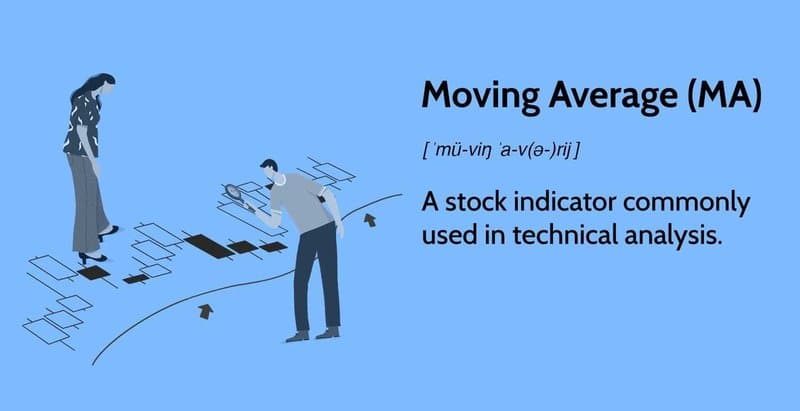
What It Is: Moving averages are one of the simplest and most widely used trading indicators. They smooth out price data to create a single flowing line that represents the average price over a specific period. The two most common types of moving averages are the Simple Moving Average (SMA) and the Exponential Moving Average (EMA).

How It Works: The SMA calculates the average price over a set number of periods, while the EMA gives more weight to recent prices, making it more responsive to new information. Traders use moving averages to identify trends, with the direction of the MA line indicating the trend direction. For example, when the price is above the MA, it indicates an uptrend, and when it is below, it indicates a downtrend.

Why It’s Effective: Moving averages are useful for identifying the overall trend direction and can be combined with other indicators to create a more comprehensive trading strategy. The crossover of two moving averages, such as the 50-day and 200-day MA, is a popular trading signal known as the “Golden Cross” (bullish) or “Death Cross” (bearish).

2. Relative Strength Index (RSI)

r1.jpeg

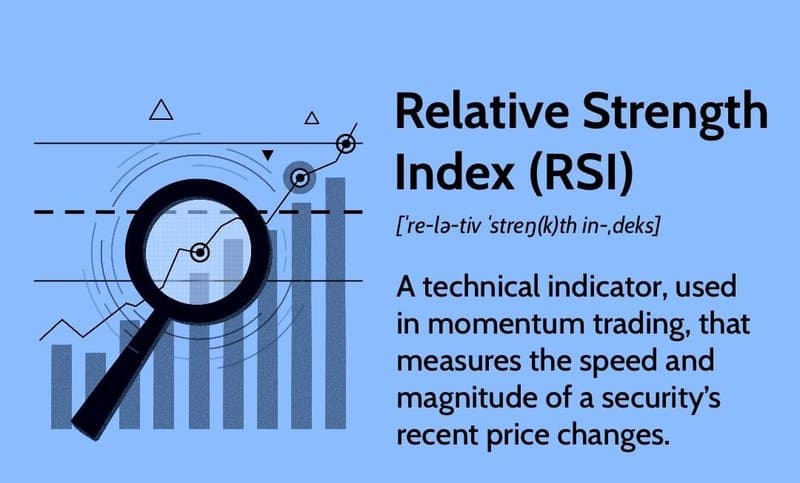
What It Is: The Relative Strength Index (RSI) is a momentum oscillator that measures the speed and change of price movements. It ranges from 0 to 100 and is typically used to identify overbought or oversold conditions in a market.

How It Works: The RSI compares the magnitude of recent gains to recent losses, helping traders determine whether an asset is overbought (above 70) or oversold (below 30). When the RSI crosses above 70, it may indicate that the asset is overbought and could be due for a correction. Conversely, when it crosses below 30, it may signal that the asset is oversold and could be poised for a rebound.

Why It’s Effective: RSI is an excellent tool for identifying potential reversal points in a market. It helps traders avoid buying into a market that is already overextended or selling into a market that is deeply oversold.

3. Moving Average Convergence Divergence (MACD)

r3.jpeg

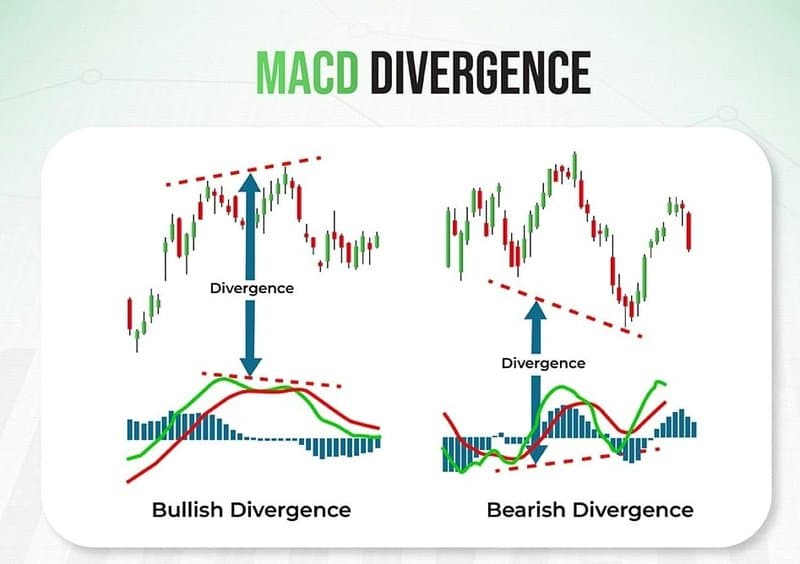
What It Is: The Moving Average Convergence Divergence (MACD) is a trend-following momentum indicator that shows the relationship between two moving averages of an asset’s price. It is one of the most reliable and popular indicators used by traders.

How It Works: The MACD is calculated by subtracting the 26-period EMA from the 12-period EMA. The result is the MACD line. A 9-period EMA of the MACD line, called the "signal line," is then plotted on top of the MACD line, which can act as a trigger for buy and sell signals. When the MACD crosses above the signal line, it generates a bullish signal, and when it crosses below, it generates a bearish signal.

Why It’s Effective: MACD is effective because it combines both trend and momentum indicators into one. It helps traders spot changes in the strength, direction, momentum, and duration of a trend. This makes it a versatile tool for identifying potential entry and exit points in various market conditions.

4. Bollinger Bands

r4.jpeg

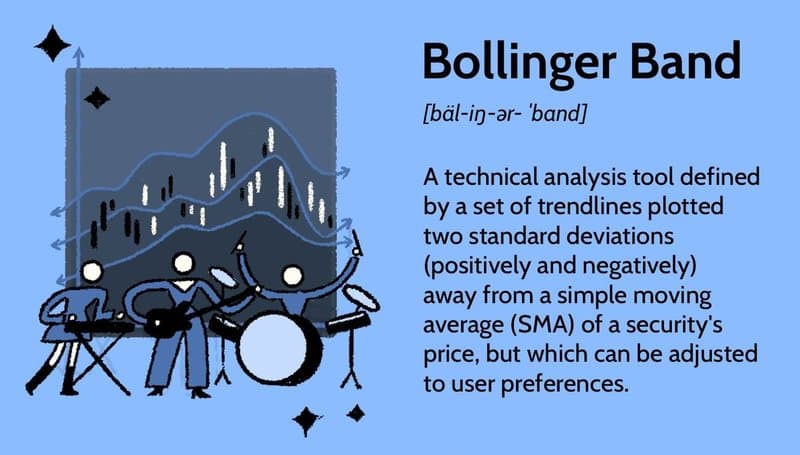
What It Is: Bollinger Bands are a volatility indicator that consists of three lines: a simple moving average (usually 20 periods) and two standard deviation lines plotted above and below the moving average. These bands expand and contract based on market volatility.

How It Works: When the market is volatile, the bands widen, and when the market is calm, the bands contract. Traders use Bollinger Bands to identify potential overbought and oversold conditions. When the price touches or moves outside the upper band, it may indicate an overbought condition, while touching or moving outside the lower band may indicate an oversold condition.

Why It’s Effective: Bollinger Bands are effective for identifying periods of high and low volatility, as well as potential reversal points. They are particularly useful in range-bound markets where the price is moving sideways, helping traders identify when to enter or exit a position based on volatility changes.

Conclusion:

Trading indicators are essential tools that provide traders with insights into market conditions, helping them make informed decisions. While no single indicator is foolproof, combining these four effective indicators—Moving Averages, RSI, MACD, and Bollinger Bands—can significantly enhance a trader’s ability to analyze the market and develop a robust trading strategy.

footer new.jpeg

Risk Warning and Disclaimer

The market carries risks, and investment should be cautious. This article does not constitute personal investment advice and has not taken into account individual users' specific investment goals, financial situations, or needs. Users should consider whether any opinions, viewpoints, or conclusions in this article are suitable for their particular circumstances. Investing based on this is at one's own responsibility.

The End
Previous
Next

Comments

0/1000

You Missed

Why are fewer and fewer people trading? Perhaps this article can provide you with the answer.

Why are fewer and fewer people trading? Perhaps this article can provide you with the answer.

According to data provided by brokers, 40% of traders give up trading after one month, and only 7% remain active after five years.

亚伦_TK_LOXmv
亚伦_TK_LOXmv
2024-06-04
Investment
Investment
2024-06-04
U.S. elections and Middle East conflict boost uncertainty, driving gold prices higher.

U.S. elections and Middle East conflict boost uncertainty, driving gold prices higher.

With the US election nearing and Middle East tensions rising, risk aversion keeps gold prices high as markets watch Fed rate decisions and US economic data.

TraderKnows
TraderKnows
2024-10-30
Foreign Exchange Trading
2024-10-30
Indonesia's central bank to continue forex intervention, rupiah to strengthen next year.

Indonesia's central bank to continue forex intervention, rupiah to strengthen next year.

Recently, the Governor of the Bank of Indonesia, Perry Warjiyo, publicly stated that they will continue to intervene in the foreign exchange market to stabilize the rupiah.

TraderKnows
TraderKnows
2024-06-05
Foreign Exchange Trading
2024-06-05
Theo Broker Review:High Risk(Suspected Fraud)

Theo Broker Review:High Risk(Suspected Fraud)

Theo (Theo Technology Co., Ltd) is an online forex trading platform. This article evaluates Theo from perspectives like corporate entity, domain registration, regulatory licenses, staff, software, and trade types.

TraderKnows
TraderKnows
2024-05-14
Pig Butchering Scam
Pig Butchering Scam
2024-05-14
Is Opixtech a legitimate forex company? Are the high returns of Opix Algo real?

Is Opixtech a legitimate forex company? Are the high returns of Opix Algo real?

No matter how well Opixtech and Chen De disguise their forex funding scheme, they can't conceal its true nature as a Ponzi scheme.

TraderKnows
TraderKnows
2024-05-10
Ponzi Scheme
Ponzi Scheme
2024-05-10

Organization

Active

TraderKnowsTraderKnows

Recent Post

Trump Invokes Defense Production Act with 850 Million USD for Coal Power to Meet AI Demand

18 hours ago

NY Fed Index Shows High Supply Chain Pressures as Geopolitical Conflicts Raise Global Inflation Con…

18 hours ago

Japan's Real Wages Rise for Fourth Consecutive Month, Fueling June BOJ Rate Hike Bets

18 hours ago

China Flexible Employment Exceeds 300 Million as Blue-Collar Wage Growth Outpaces White-Collar for…

18 hours ago

South Korean Stocks Post Steepest Weekly Drop Since March as Tech Valuations Reset

18 hours ago

China Commercial Paper Rates Drop in Early June Amid Rising Bank Demand

18 hours ago

UK House Prices Unexpectedly Fall in May as Geopolitical Tensions Push Up Borrowing Costs

18 hours ago

Massive Intervention Fails to Save Yen as Short Positions Surge Near Historic Lows

18 hours ago

AI Momentum Pauses as Broadcom Outlook Misses High Expectations; Markets Await Payrolls

18 hours ago

SpaceX Launches 75B USD IPO Roadshow as Access Blocked in Mainland China and Hong Kong

18 hours ago

Global Gold ETFs See $2 Billion Outflows in May as Capital Pivots to Tech Assets

18 hours ago

Nikkei Drops Over 1% on Tech Sector Pullback While Real Wage Growth Provides Support

18 hours ago

South Korea Lifts Mandatory Reporting for Crypto Transfers Over 10M Won

18 hours ago

Amundi Says Asian AI Stocks Supported by Fundamentals as Fed Path Poses Key Risk

18 hours ago

Taiwan Stocks Close 1.33% Lower on Broadcom Drop But Hold Key Technical Support

18 hours ago

You Missed

Why are fewer and fewer people trading? Perhaps this article can provide you with the answer.

Why are fewer and fewer people trading? Perhaps this article can provide you with the answer.

According to data provided by brokers, 40% of traders give up trading after one month, and only 7% remain active after five years.

亚伦_TK_LOXmv
亚伦_TK_LOXmv
2024-06-04
Investment
Investment
2024-06-04
U.S. elections and Middle East conflict boost uncertainty, driving gold prices higher.

U.S. elections and Middle East conflict boost uncertainty, driving gold prices higher.

With the US election nearing and Middle East tensions rising, risk aversion keeps gold prices high as markets watch Fed rate decisions and US economic data.

TraderKnows
TraderKnows
2024-10-30
Foreign Exchange Trading
2024-10-30
Indonesia's central bank to continue forex intervention, rupiah to strengthen next year.

Indonesia's central bank to continue forex intervention, rupiah to strengthen next year.

Recently, the Governor of the Bank of Indonesia, Perry Warjiyo, publicly stated that they will continue to intervene in the foreign exchange market to stabilize the rupiah.

TraderKnows
TraderKnows
2024-06-05
Foreign Exchange Trading
2024-06-05
Theo Broker Review:High Risk(Suspected Fraud)

Theo Broker Review:High Risk(Suspected Fraud)

Theo (Theo Technology Co., Ltd) is an online forex trading platform. This article evaluates Theo from perspectives like corporate entity, domain registration, regulatory licenses, staff, software, and trade types.

TraderKnows
TraderKnows
2024-05-14
Pig Butchering Scam
Pig Butchering Scam
2024-05-14
Is Opixtech a legitimate forex company? Are the high returns of Opix Algo real?

Is Opixtech a legitimate forex company? Are the high returns of Opix Algo real?

No matter how well Opixtech and Chen De disguise their forex funding scheme, they can't conceal its true nature as a Ponzi scheme.

TraderKnows
TraderKnows
2024-05-10
Ponzi Scheme
Ponzi Scheme
2024-05-10

Risk Warning

TraderKnows is a financial media platform, with information displayed coming from public networks or uploaded by users. TraderKnows does not endorse any trading platform or variety. We bear no responsibility for any trading disputes or losses arising from the use of this information. Please be aware that displayed information may be delayed, and users should independently verify it to ensure its accuracy.