• Home
  • Categories
  • News
  • Community
EN
EN
Home
CategoriesNewsGlossaryCommunity
Contact Us
Social Media
Region
🌏International
Region
🌏International
Contact
Home
/
News
/
A step-by-step guide to BTC and ETH pair trading analysis

A step-by-step guide to BTC and ETH pair trading analysis

阿海阿海
2024-07-09
Summary:I hope everyone can enhance the success rate and stability of trading through scientific methods and rigorous analysis.

The purpose of this article is to help readers understand how to engage in long-term, stable trading based on legitimate trading theories through orthodox quantitative analysis trading strategies. We hope that you can increase the success rate and stability of your trades through scientific methods and rigorous analysis. Note: If you are looking for quick profits of several percentage points daily or doubling your money in a few days, and you start by asking about rates of return, please look elsewhere. Those unwilling to learn, your knowledge determines your mind and your wallet.

I. Introduction

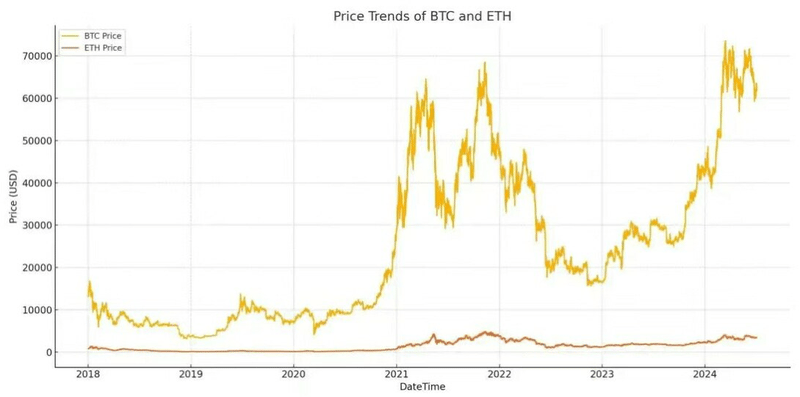
Based on the first article that explained what pair trading is, this article aims to analyze the cointegration relationship between Bitcoin (BTC) and Ethereum (ETH) to determine if they are suitable for pair trading.

Image 4.png

Cointegration, the primary element of pair trading, let's explain the theory.

In this image, the distance between the little girl (Type A) and the dog (Type B) vividly describes the cointegration relationship in pair trading.

WPS Image (1).png

Just like the girl walking her dog, even though the leash allows the dog some freedom of movement, the dog is ultimately constrained by the leash and cannot stray too far from the girl. This reflects the cointegration relationship between two assets in pair trading: although their prices may fluctuate in the short term, they maintain a certain synchronized relationship over the long term, much like the leash keeping the dog close to the girl. This relationship ensures that regardless of the walking path, the distance between them stays within a bounded range, symbolizing the stability sought in pair trading arbitrage opportunities.

Image 2.png

II. Cointegration Analysis

We first used two methods to test the cointegration relationship between BTC and ETH: validating the cointegration relationship is the most critical step for pair trading, as it helps you select more stable, potentially profitable asset pairs, reduce trading risk, and improve trading success rates.

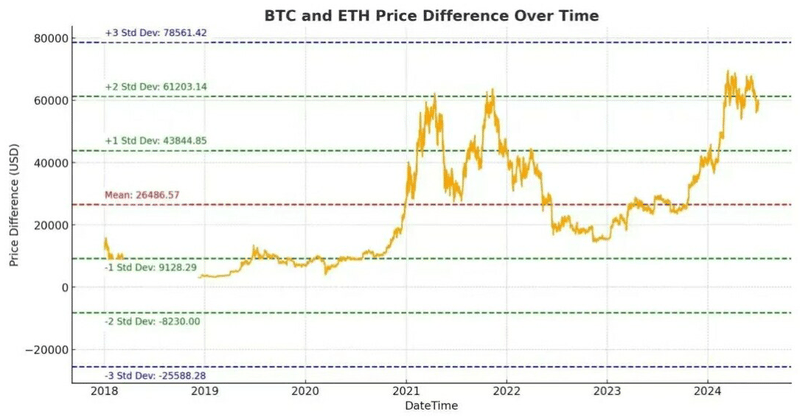
It can be simply understood as two assets having a common price movement trend over the long term. Even though their prices may fluctuate in the short term, their price differences will stabilize over the long term.

1. Engle-Granger Two-Step Method The Engle-Granger two-step method is used to detect whether there is a cointegration relationship between BTC and ETH. This method involves two steps:

Regression Analysis: Conduct linear regression analysis on the prices of BTC and ETH to calculate their residuals.

Stationarity Test: Perform an Augmented Dickey-Fuller (ADF) test on the residuals to determine if they are stationary. If the residuals are stationary, it indicates that the two have a common movement trend in the long term.

Results:

ADF Test Statistic: -2.6849

p-value: 0.0751

Critical Values: 1% -3.430, 5% -2.862, 10% -2.567

At the 5% significance level, the ADF test statistic fails to be less than the 5% critical value, and thus we cannot confirm that the residuals are stationary, making it impossible to confirm a stable cointegration relationship between BTC and ETH in the long term.

2. Johansen Cointegration Test We used the Johansen cointegration test to further validate the cointegration relationship between BTC and ETH.

Results:

The first test statistic: 14.918756, critical values: 90% - 13.4294, 95% - 15.4943, 99% - 19.9349

The second test statistic: 3.466325, critical values: 90% - 2.7055, 95% - 3.8415, 99% - 6.6349

At the 90% confidence level, the first test statistic is greater than the 90% critical value, and the second test statistic is also greater than the 90% critical value, indicating the existence of a cointegration relationship between BTC and ETH.

Image 3.png

WPS Image (1).png

III. Differences in Methods

The different results of the Engle-Granger two-step method and the Johansen test are due to their differing testing methods and applicable conditions.

Engle-Granger Two-Step Method:

Single-equation method: Handles the relationship between two variables at a time.

Dependent on the accuracy of the regression model: If the regression model is inaccurate, the results may also be inaccurate.

Sensitive to data preprocessing: If the data is not well processed, the results may be biased.

Johansen Test:

Multi-equation method: Can handle multiple time series relationships simultaneously.

Vector Autoregression Model (VAR): Uses more complex models to determine cointegration relationships.

High statistical power: Especially in large samples, it can more accurately detect cointegration relationships.

Therefore, the Engle-Granger two-step method may produce unstable results due to sample size or data characteristics, whereas the Johansen test is more robust and can provide accurate results in more complex situations.

IV. Correlation Analysis

To further verify the price relationship between BTC and ETH, we performed correlation coefficient and lagged correlation analysis.

1. Correlation Coefficient Calculation

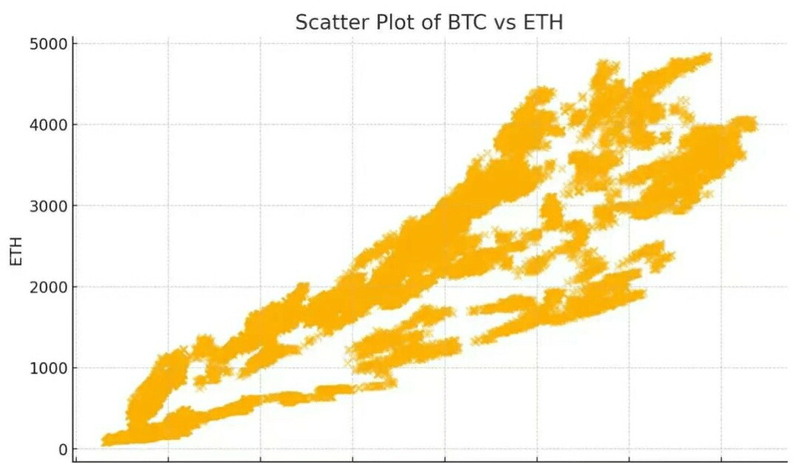
Result: The correlation coefficient is 0.918, indicating a strong positive correlation between the two.

2. Lagged Correlation Analysis

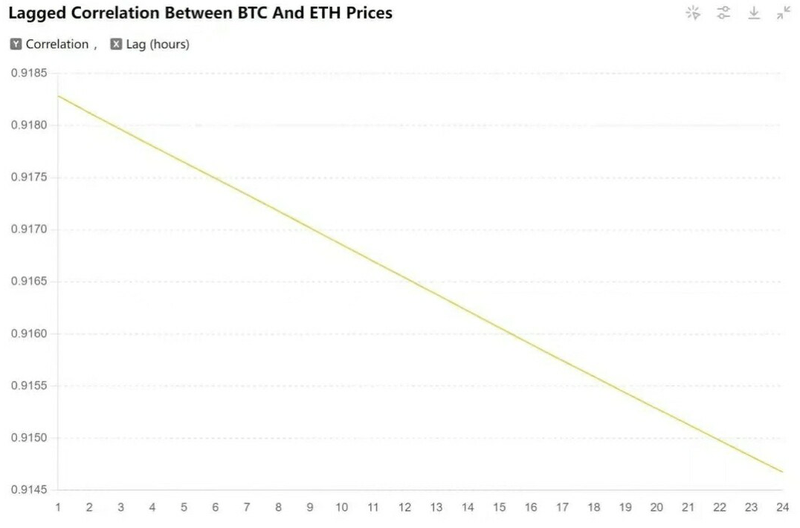
We analyzed the lagged correlation from 1 hour to 24 hours to determine the impact of BTC price changes on ETH price.

Result: At 1-hour lag, the correlation is very high, close to 0.92. As the lag time increases, the correlation gradually decreases but remains at a high level. At 24-hour lag, the correlation is 0.914.

WPS Image (1).png

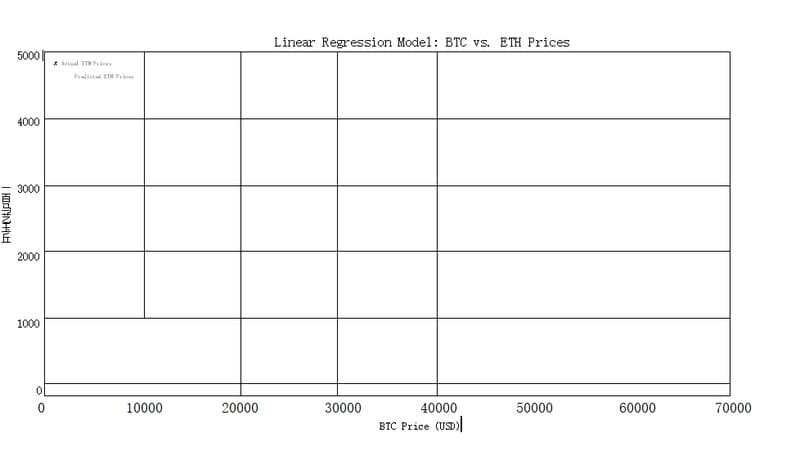
V. Linear Regression Model Analysis

We constructed a linear regression model, using BTC price as the independent variable and ETH price as the dependent variable, to analyze the relationship between the two.

Result: Regression Equation: ETH price = 0.0592 × BTC price - 46.57. The model results indicate that BTC price can explain most of the variations in ETH price, with a good fit for the model.

WeChat Screenshot_20240709095441.png

VI. Comprehensive Summary

Although the Engle-Granger two-step method did not significantly confirm the cointegration relationship between BTC and ETH, the Johansen test indicated a cointegration relationship in the long term. Additionally, the correlation analysis and linear regression model further validated the strong correlation and price linkage between BTC and ETH. Therefore, it is theoretically possible to consider BTC and ETH for pair trading, designing short-term pair trading strategy models while cautiously engaging in long-term pair trading.

VII. Suitability for Strategy Model Development

Considering that the volatility of the crypto market is much higher than traditional currency markets, intense price fluctuations of BTC and ETH may increase the risk of pair trading. In conditions of low liquidity, short-term trade execution may be affected, leading to increased slippage. This pair trading carries high risk.

For more related trades, please contact CWG customer Ahai:

WeChat Image_20240708172321.jpg

Risk Warning and Disclaimer

The market carries risks, and investment should be cautious. This article does not constitute personal investment advice and has not taken into account individual users' specific investment goals, financial situations, or needs. Users should consider whether any opinions, viewpoints, or conclusions in this article are suitable for their particular circumstances. Investing based on this is at one's own responsibility.

The End
Previous
Next

Comments

0/1000

You Missed

Why are fewer and fewer people trading? Perhaps this article can provide you with the answer.

Why are fewer and fewer people trading? Perhaps this article can provide you with the answer.

According to data provided by brokers, 40% of traders give up trading after one month, and only 7% remain active after five years.

亚伦_TK_LOXmv
亚伦_TK_LOXmv
2024-06-04
Investment
Investment
2024-06-04
U.S. elections and Middle East conflict boost uncertainty, driving gold prices higher.

U.S. elections and Middle East conflict boost uncertainty, driving gold prices higher.

With the US election nearing and Middle East tensions rising, risk aversion keeps gold prices high as markets watch Fed rate decisions and US economic data.

TraderKnows
TraderKnows
2024-10-30
Foreign Exchange Trading
2024-10-30
Indonesia's central bank to continue forex intervention, rupiah to strengthen next year.

Indonesia's central bank to continue forex intervention, rupiah to strengthen next year.

Recently, the Governor of the Bank of Indonesia, Perry Warjiyo, publicly stated that they will continue to intervene in the foreign exchange market to stabilize the rupiah.

TraderKnows
TraderKnows
2024-06-05
Foreign Exchange Trading
2024-06-05
Theo Broker Review:High Risk(Suspected Fraud)

Theo Broker Review:High Risk(Suspected Fraud)

Theo (Theo Technology Co., Ltd) is an online forex trading platform. This article evaluates Theo from perspectives like corporate entity, domain registration, regulatory licenses, staff, software, and trade types.

TraderKnows
TraderKnows
2024-05-14
Pig Butchering Scam
Pig Butchering Scam
2024-05-14
Is Opixtech a legitimate forex company? Are the high returns of Opix Algo real?

Is Opixtech a legitimate forex company? Are the high returns of Opix Algo real?

No matter how well Opixtech and Chen De disguise their forex funding scheme, they can't conceal its true nature as a Ponzi scheme.

TraderKnows
TraderKnows
2024-05-10
Ponzi Scheme
Ponzi Scheme
2024-05-10

Wiki

Investment

Investing refers to the act of allocating funds or other resources into certain assets or projects with the expectation of obtaining future returns or benefits. The primary aim of investing is usually to enhance asset value, achieve financial goals, preserve and grow value, or accomplish a specific objective.

Organization

Active

CWG MarketsCWG Markets

Recent Post

Trump Invokes Defense Production Act with 850 Million USD for Coal Power to Meet AI Demand

06-05

NY Fed Index Shows High Supply Chain Pressures as Geopolitical Conflicts Raise Global Inflation Con…

06-05

Japan's Real Wages Rise for Fourth Consecutive Month, Fueling June BOJ Rate Hike Bets

06-05

China Flexible Employment Exceeds 300 Million as Blue-Collar Wage Growth Outpaces White-Collar for…

06-05

South Korean Stocks Post Steepest Weekly Drop Since March as Tech Valuations Reset

06-05

China Commercial Paper Rates Drop in Early June Amid Rising Bank Demand

06-05

UK House Prices Unexpectedly Fall in May as Geopolitical Tensions Push Up Borrowing Costs

06-05

Massive Intervention Fails to Save Yen as Short Positions Surge Near Historic Lows

06-05

AI Momentum Pauses as Broadcom Outlook Misses High Expectations; Markets Await Payrolls

06-05

SpaceX Launches 75B USD IPO Roadshow as Access Blocked in Mainland China and Hong Kong

06-05

Global Gold ETFs See $2 Billion Outflows in May as Capital Pivots to Tech Assets

06-05

Nikkei Drops Over 1% on Tech Sector Pullback While Real Wage Growth Provides Support

06-05

South Korea Lifts Mandatory Reporting for Crypto Transfers Over 10M Won

06-05

Amundi Says Asian AI Stocks Supported by Fundamentals as Fed Path Poses Key Risk

06-05

Taiwan Stocks Close 1.33% Lower on Broadcom Drop But Hold Key Technical Support

06-05

You Missed

Why are fewer and fewer people trading? Perhaps this article can provide you with the answer.

Why are fewer and fewer people trading? Perhaps this article can provide you with the answer.

According to data provided by brokers, 40% of traders give up trading after one month, and only 7% remain active after five years.

亚伦_TK_LOXmv
亚伦_TK_LOXmv
2024-06-04
Investment
Investment
2024-06-04
U.S. elections and Middle East conflict boost uncertainty, driving gold prices higher.

U.S. elections and Middle East conflict boost uncertainty, driving gold prices higher.

With the US election nearing and Middle East tensions rising, risk aversion keeps gold prices high as markets watch Fed rate decisions and US economic data.

TraderKnows
TraderKnows
2024-10-30
Foreign Exchange Trading
2024-10-30
Indonesia's central bank to continue forex intervention, rupiah to strengthen next year.

Indonesia's central bank to continue forex intervention, rupiah to strengthen next year.

Recently, the Governor of the Bank of Indonesia, Perry Warjiyo, publicly stated that they will continue to intervene in the foreign exchange market to stabilize the rupiah.

TraderKnows
TraderKnows
2024-06-05
Foreign Exchange Trading
2024-06-05
Theo Broker Review:High Risk(Suspected Fraud)

Theo Broker Review:High Risk(Suspected Fraud)

Theo (Theo Technology Co., Ltd) is an online forex trading platform. This article evaluates Theo from perspectives like corporate entity, domain registration, regulatory licenses, staff, software, and trade types.

TraderKnows
TraderKnows
2024-05-14
Pig Butchering Scam
Pig Butchering Scam
2024-05-14
Is Opixtech a legitimate forex company? Are the high returns of Opix Algo real?

Is Opixtech a legitimate forex company? Are the high returns of Opix Algo real?

No matter how well Opixtech and Chen De disguise their forex funding scheme, they can't conceal its true nature as a Ponzi scheme.

TraderKnows
TraderKnows
2024-05-10
Ponzi Scheme
Ponzi Scheme
2024-05-10

Risk Warning

TraderKnows is a financial media platform, with information displayed coming from public networks or uploaded by users. TraderKnows does not endorse any trading platform or variety. We bear no responsibility for any trading disputes or losses arising from the use of this information. Please be aware that displayed information may be delayed, and users should independently verify it to ensure its accuracy.