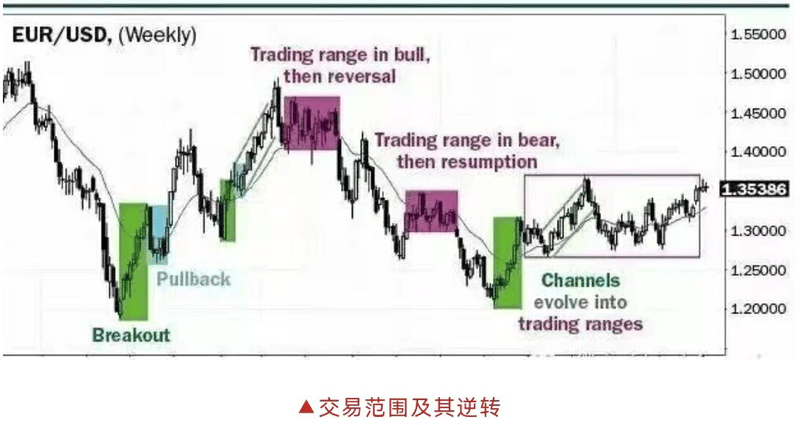
Traders create the market, allowing each trader to quickly buy or sell at their desired prices. The market is constantly seeking a fair price for both parties, which is why the market spends most of the time in a trading range, a consensus area.
Upward or downward breakouts are often brief, occurring because buyers and sellers both believe the price is too low, leading to a bullish breakout, or too high, leading to a bearish breakout. The market needs to quickly move to a new consensus zone.
So, what is a consensus zone? It's a trading range. Within this price range, there is confusion, so trades are rarely definitive. The market remains in basic balance most of the time, with rational debate between bulls and bears. If you feel confused or have good reasons not to trade, or if you see buying or selling as reasonable, you can assume the market is in a trading range.
This is the goal of all markets. They are always looking for a price that bulls find reasonable to buy and bears find reasonable to sell. When the market is at the higher end of this range, bulls find it less reasonable and buy less. Many bulls take small profits and sell. Meanwhile, bears start seeing the prices as more reasonable and begin to sell more. This imbalance will cause prices to drop.
Following the Trend
Successful breakouts form trends, continuing upward to the next resistance level or downward to the next support level, seeking a price everyone deems worth trading. This marks the next trading range.
When the market is trending, it will always try to reverse, but due to inertia, 80% of attempts will fail, causing prices to return to the trend. Each reversal attempt occurs at a resistance level, even if you can’t see it, mainly due to profit-taking. In the later stages of a trend, corrections become more severe and complex, with counter-trend actions playing a more significant role.
If a correction begins, the impact of the trend will diminish until it completely disappears, and the market will enter a trading range. At that point, the final price direction's bullish or bearish breakout will be a 50% chance. Both continuing the trend or reversing it is possible.
A trader's most valuable skill is understanding price breakouts. Breaking what? Everything. The simplest breakout is surpassing the previous bar’s high or low, but the market can break past prior highs, lows, trend lines, ranges, moving averages, or any form of support or resistance.
If the current bar is above the previous high, will there be more buyers or sellers? You’ll ask if this breakout will succeed and yield enough bullish profit or fail and reverse, starting a bearish profitable trade.
If a breakout has characteristics likely to succeed, these are signals of buyer support. Conversely, if not, they signify seller pressure, increasing the chances of the breakout failing and reversing downward.
If the market has 100 candlesticks in a trading range, the chance of a successful breakout is very low. As mentioned earlier, the market has inertia and tends to repeat past actions; when in a trading range, most breakouts will fail, even if strong enough to reach the range’s top. This is the resistance test for buying.
You can view the upper limit of a trading range, and all support and resistance levels, as a large magnet. The closer the market is to the magnet, the stronger the pull, and the faster the market will be drawn to it. Once the market reaches the magnet, the magnetic strength weakens and eventually disappears.
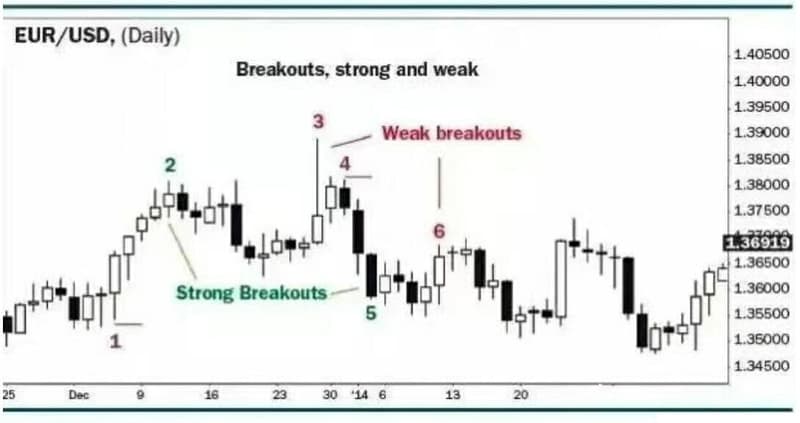
Strong Breakouts vs. Weak Breakouts
Why does this happen? In a trading range, as the market rises, both bulls and bears expect it to reach the high point. If you’re a bear and know the market is nearing resistance, you’ll likely stop selling, hoping for a better price. This means there will be relatively fewer bears below the resistance level.
Bulls, knowing the market is approaching a high, will buy more aggressively, expecting it to touch or slightly exceed the resistance level. Bulls buying and bears stopping selling usually create one or several candlesticks quickly reaching the range's top. Then, bulls take profits, and bears start selling heavily.
The result is a market reversal, even if it strongly reaches resistance. The top becomes a buy vacuum area; if it nears the bottom, it may enter a sell vacuum area, forming one or more low-closing candlesticks. However, as most range trading breakouts fail, the market might return to its starting point. Eventually, some breakout will succeed, establishing a trend. Buying or selling pressure signals within a trading range might draw early market entries from swing traders, but most breakout attempts will fail.
Microchannels
What is a 5-minute chart? It is often mistakenly thought of as a price chart. All two-dimensional charts at least have two contributing elements – dimensions or variables – both affecting the trend. Even though no up or down price movement can exist without price, time may be more important, especially early on. Microchannels can be seen as breakouts, usually of a higher frequency time frame chart. When candlesticks are small, it’s easy to miss the market’s information. For instance, if there are 10 consecutive, insignificant candlesticks, and each low is the same as or higher than the previous candlestick’s low, it's a 10-candlestick bullish microchannel.
This means bulls have dominated the market in the past 10 candlesticks, even if the candlesticks and prices were minimally rising. If a microchannel occurs early in a trend, it usually accompanies a strong acceleration and breakout. If it appears at the tail end, it often signals market exhaustion, potentially leading to a quick pullback.
Observing Market Cycles
The market is always shifting between trends and trading ranges, which constitutes a market cycle. Market cycles occur in all time frames, with markets rising, falling, and sometimes oscillating. While many traders aim for trend trading in longer time frames, it’s not necessary.
What a trader needs to profit is the chart in front of them, regardless of the market, chart type, or time frame. If traders can read and act on the chart, each chart contains ample opportunities. Remember, even in consolidation, each candlestick has enough volume. Even in the smallest 5-minute E-mini chart, each candlestick can produce about 5,000 contracts. Every candlestick in each market can present reasons to buy or sell, and traders can learn a lot through practice. The key is to spot these opportunities early, decide which are worth trading, and build and manage a reasonable trade.
Market cycles are the constant cycles of trends and trading ranges manifested in each chart. Cycles have nuances. The most intense phase of a trend is the breakout. Likely, a few candlesticks will follow, but due to how long it takes to stop, risk increases. Market changes so rapidly that errors can heighten risks significantly.
If the market declines, the trend weakens and enters a bottleneck period of range. Within this bottleneck, trading becomes more bi-directional. For instance, in a bullish bottleneck, bears will scale up and establish short positions. As both sides continue trading, the pullback trend intensifies, producing more candlesticks, ultimately increasing the pullback’s intensity, leading the market to lose direction and enter oscillation. Since bottleneck periods typically signal the start of range oscillation, every bullish bottleneck can be seen as a bear flag, and every bearish bottleneck as a bullish flag.
Once a reversal trend becomes evident, and range trading begins, the market typically tries to return to the initial bottleneck period. One reason is that bears start increasing their positions after the first pullback. If the market moves down, many bears wish to exit their positions at the bottleneck's low point. With bears buying at the bottleneck’s bottom, there will be a lack of corresponding sellers. Bulls, knowing the market started from the first pullback’s bottom, will buy again when the market hits that level, expecting another rise.
At the bottleneck top, bears will short again. Bulls think the market has entered range trading, so they exit their long positions at the range’s top. Bears sell at the high to establish short positions, and bulls sell to take profits. The opposite happens at the range's bottom. Eventually, there will be a breakout in one direction, and the process begins anew.
Price breakouts are the strongest during trends, with each candlestick aligning with the trend. In a bull trend, there will be strong bull candlesticks, indicating significant buying pressure. In a bear trend, there will be strong selling pressure. "Buying Pressure (below)" exemplifies a strong bullish price breakout, showing numerous buying pressure signals.
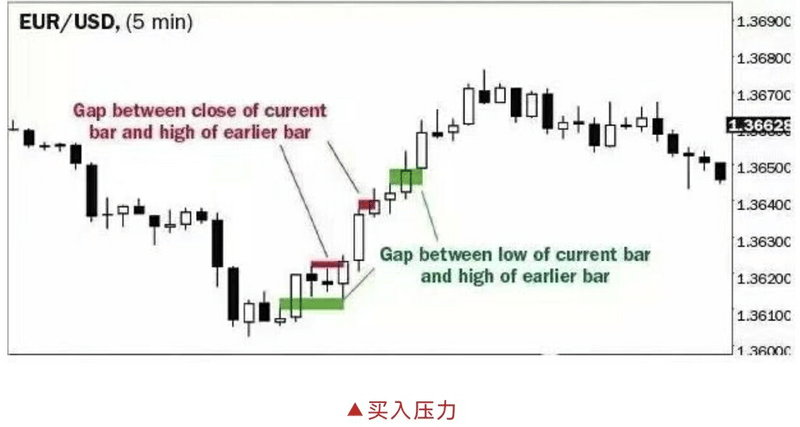
The most obvious sign of buying pressure is a bullish trend candlestick closing near its high. If it opens lower, it shows even more urgency, indicating bulls are so keen to buy that they do not wait for even a minor pullback. A candlestick closing at or near the top means bulls are buying directly from the top. If they are willing to buy at a higher price, they will certainly buy at a slightly lower one, signaling that even minor pullbacks might be bought.
If a bullish trend candlestick is larger than the average, it indicates more buying pressure. If there are two or three strong bullish candlesticks, the price breakout will be even stronger. If the current candlestick closes higher than the previous one, creating a gap, it indicates buying pressure.
Traders should watch the next candlestick’s low to see if it is higher than the previous two candlesticks’ highs. If it is, this gap acts as a measuring window, leading to an upward move. If a trend candlestick closes above other resistance levels, such as a bearish trend line, a moving average, or the top of a trading range, it indicates more buying pressure, especially if the next candlestick also closes bullish. This increases the chance of higher prices, even with potential pullbacks.
Feel free to leave comments and click "Like" at the end of the article to encourage us.
Compiled from "The Indomitable Investor" by Steven Sears. The content published on this WeChat official account is for reference only and does not represent the opinions of Forex Rangyabang, nor does it constitute any investment advice. Copyright belongs to the original authors; for copyright issues, please contact us through the WeChat background.
Add the editor's personal WeChat (forextop66)
For more exciting content, please follow
Forex Rangyabang APP