What is Support?
Support, in technical analysis, refers to a specific price level or area where a downtrend in price encounters resistance. Support is a key element in price movements, often marking the bottom of a price decline or the starting point of a price rebound.
Support levels represent the price points where investors show interest and tend to purchase assets to push the price up. When the price nears or reaches a support level, buying activity typically intensifies in the market, leading to a price rebound as investors buy assets.
Support can be a specific price level or a price zone. Technical analysts and traders identify support levels by plotting price charts and observing past price movements. Support is often determined by significant lows in price movements, the starting points of price oscillations, or other technical indicators.
In technical analysis, support levels are considered crucial references for predicting rebounds or reversals after price declines. If the price successfully breaks below a support level, it may indicate an increased likelihood of further price declines. Conversely, if the price bounces back above the support level, it may validate the support and suggest continued price rebounds.
Methods to Identify Support Levels
There are various tools and indicators in technical analysis to identify support levels, and here are some common methods.
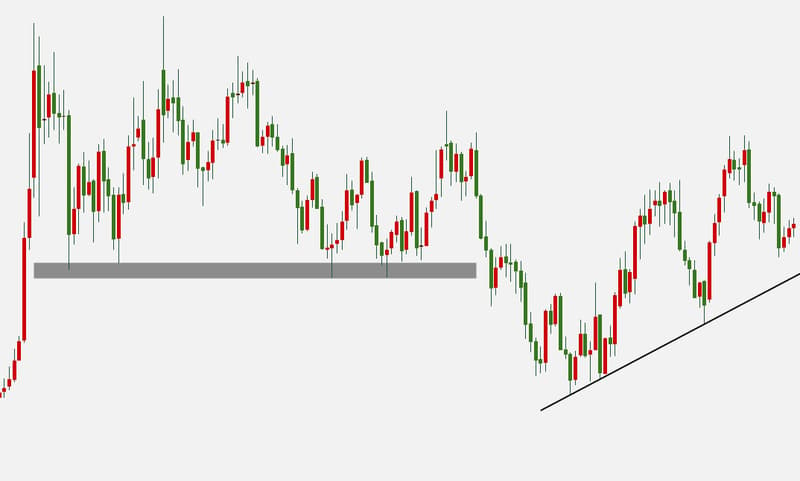
- Trendlines: Identify support levels by drawing trendlines. In a downtrend, an ascending trendline connecting multiple price lows may serve as a support level. Investors pay attention to potential rebounds when the price nears or contacts the trendline.
- Horizontal Support: Observe past price movements, especially areas where prices rebounded or halted declines. Support levels formed at such horizontal points may serve as future support zones. This can be determined by the lows on price charts or the starting points of price oscillations.
- Moving Averages: Use moving averages to identify support levels. Common moving averages include the Simple Moving Average (SMA) and the Exponential Moving Average (EMA). When the price nears or touches a moving average, it may become a support level as the moving average represents the average price over a period.
- Fibonacci Retracements: Utilize Fibonacci retracement levels to find support levels. Apply Fibonacci retracement levels to recent price increases or declines, and lower retracement levels may become support levels.
- Target Price: Combine other technical analysis indicators, such as support and resistance levels, chart patterns, and indicator signals, to determine the target price for support levels. These target prices are usually derived from a comprehensive analysis of multiple factors.
Uses of Support Levels
Support levels are widely used in technical analysis and have significant uses for traders and analysts. Here are some common applications of support levels.
- Identifying Entry Points: Support levels can serve as reference points for buying. When the price nears or touches a support level, it may rebound or stop declining, allowing investors to set buy orders near the support level to capture rebound opportunities.
- Risk Management: Support levels can be reference points for setting stop-loss orders. If the price breaks below the support level and continues to decline, it may indicate the invalidity of the support level and potential further declines. Investors can set stop-loss orders to manage risk and limit potential losses.
- Predicting Price Rebounds: The presence of support levels can help predict price rebounds. If the price successfully rebounds and rises above the support level, it may confirm the support level's effectiveness, suggesting further price increases. Investors can use support rebound signals to judge short-term price trends and potential upward targets.
- Validating Other Indicators: Support levels can be combined with other technical indicators and chart patterns to validate the effectiveness of trading signals. When support levels align with other indicators' signals, it can enhance the credibility of trading decisions.
- Observing Market Sentiment: Breaks or rebounds at support levels can influence market sentiment. A successful rebound and recovery above a support level may trigger increased buying activity, making market sentiment bullish. Conversely, if the price breaks the support level and continues to decline, it may trigger selling activity, making market sentiment bearish.