What is a Doji Star Pattern?
The Doji Star Pattern is a classic price pattern on a chart featuring a small body and almost equal upper and lower shadows. This pattern usually indicates market equilibrium, suggesting a balance of buying and selling forces or potential trend reversal, and has the following characteristics.
- Small body: The body of the Doji Star Pattern is usually small, indicating that the opening and closing prices are very close or nearly equal. This reflects the relative balance between buying and selling forces in the market.
- Equal or close upper and lower shadows: The upper and lower shadows of the Doji Star Pattern are usually very close or equal, indicating a small range of market fluctuations and offsetting buying and selling forces.
- Indicates uncertainty: The appearance of a Doji Star often signals increased market uncertainty, with investors feeling hesitant about the trend direction.
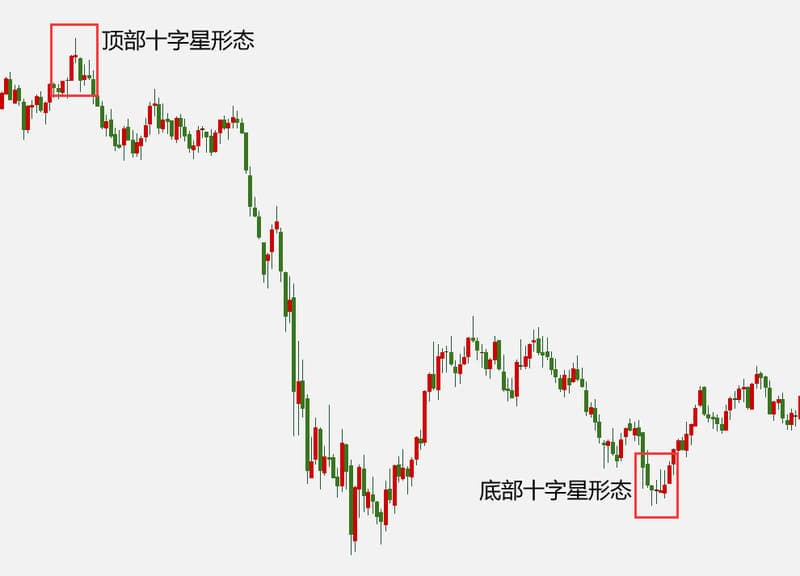
- Trend reversal signal: The appearance of a Doji Star in an uptrend or downtrend, especially at the top or bottom of the trend, may indicate an impending trend reversal.
- Complemented by other technical indicators: Traders often use the Doji Star Pattern in conjunction with other technical indicators, such as moving averages and Relative Strength Index (RSI), to obtain stronger trading signals and confirmation.
Classification of Doji Star Patterns
Doji Star Patterns can be classified according to their position and characteristics. Here are some common classifications:
- Evening Doji Star: This pattern occurs in an uptrend and consists of a large bullish candlestick, a small body (Doji), and a large bearish candlestick. It suggests a potential reversal to a downtrend.
- Morning Doji Star: This pattern appears in a downtrend and consists of a large bearish candlestick, a small body (Doji), and a large bullish candlestick. It hints at a possible reversal to an uptrend.
- Long-Legged Doji: This type of Doji has long upper and lower shadows and a small or almost non-existent body. It indicates market equilibrium and uncertainty without a clear trend direction.
- High Wave Doji: This Doji pattern has very long upper and lower shadows with a small body, signaling a balance of buying and selling forces and price fluctuations.
Usage of the Doji Star Pattern
The Doji Star Pattern is widely used in technical analysis to provide key signals and indications for judging market trends and predicting price changes. Here are some common usages:
- Trend reversal signal: When a Doji Star Pattern appears in a clear uptrend or downtrend, it may indicate that the trend is about to end or reverse. If an Evening Doji Star is seen in an uptrend or a Morning Doji Star in a downtrend, this could be a reversal signal suggesting a change in trend.
- Support and resistance levels: The small body of the Doji Star Pattern signifies a relative balance between buying and selling forces. When it appears around significant support or resistance levels, it may indicate these levels have strong influence and could potentially cause a price reversal or rebound.
- Uncertainty signal: The Doji Star Pattern denotes market uncertainty and balance, lacking a clear trend direction. This might be the result of the market waiting for important news or events. In such cases, traders might choose to stay on the sidelines to avoid entering the market prematurely.
- Complement with other indicators: The Doji Star Pattern is most effectively used when combined with other technical indicators and price patterns. For example, combining it with trend lines, moving averages, oscillators, etc., can provide more comprehensive market analysis and trading decision support.