What is a Bearish Engulfing Pattern?
A Bearish Engulfing Pattern is a Japanese candlestick pattern used to analyze potential trend reversal signals in stock, futures, forex, and other financial markets. It consists of two consecutive candles and typically appears in an uptrend, indicating that prices might decline.
The appearance of a Bearish Engulfing Pattern is considered a bearish signal, and investors may use it as a sell signal or a reversal signal for making trading decisions. In practice, investors should confirm the pattern and integrate it with trends, support and resistance levels, and other technical analysis tools to enhance the accuracy of their trading decisions.
Characteristics of a Bearish Engulfing Pattern
The appearance of a Bearish Engulfing Pattern is considered a bearish signal, and investors can use it as a sell or reversal signal in their trading decisions. Here are some common characteristics of a Bearish Engulfing Pattern:
- First Candle: The first candle is a smaller bullish (upward) candlestick, representing the current uptrend.
- Second Candle: The second candle is a larger bearish (downward) candlestick that completely "engulfs" the body of the first bullish candlestick, indicating increased selling pressure and potential price decline.
- Range of the Bearish Candlestick: The body of the second bearish candlestick should be larger than the body of the first bullish candlestick, preferably with no upper shadow or a very small one.
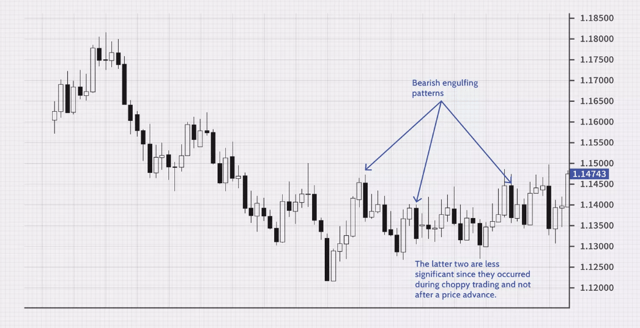
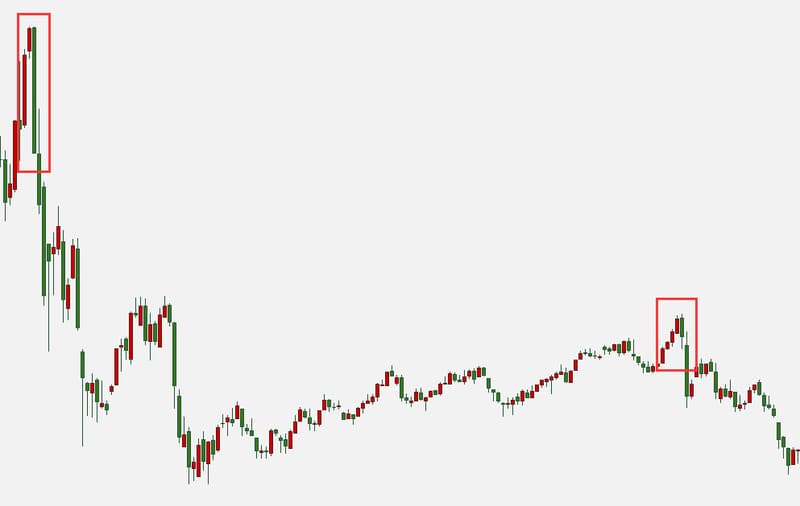
- Position on the Chart: Bearish Engulfing Patterns typically appear at the top of an uptrend, serving as a reversal signal that suggests potential price decline.
- Volume: Although not necessary, the volume is often relatively high when a Bearish Engulfing Pattern appears, indicating a shift in market participant sentiment.
Advantages and Disadvantages of the Bearish Engulfing Pattern
As a trend reversal signal, the Bearish Engulfing Pattern has several common advantages and disadvantages in technical analysis and investment decision-making.
Advantages
- Reversal Signal: The Bearish Engulfing Pattern is considered a trend reversal signal, providing investors with valuable clues about potential price declines. This can help investors capture reversal opportunities in the market and adjust their trading strategies in a timely manner.
- Ease of Identification: The pattern is relatively simple and easy to recognize and understand. By observing two consecutive candles, one can determine the presence of the pattern without the need for complex indicators or calculations.
- Tool for Comprehensive Analysis: Although the Bearish Engulfing Pattern alone is insufficient for making trading decisions, when combined with other technical indicators, trend lines, and support and resistance levels during comprehensive analysis, it can provide more reliable trading signals and accurate judgments.
Disadvantages
- Importance of Signal Confirmation: A standalone Bearish Engulfing Pattern is not reliable enough for trading decisions. It needs confirmation from other technical indicators and chart patterns. Therefore, investors should integrate the pattern with other analysis tools to enhance its reliability.
- Risk of False Signals: While the Bearish Engulfing Pattern is considered a trend reversal signal, not every occurrence accurately predicts price decline. Sometimes, it may generate misleading false signals, leading to trading losses. Cautious evaluation and validation of the pattern are necessary.
- Market Risks and Uncontrollable Factors: Markets are risky and uncertain, with prices influenced by various factors. Even when a Bearish Engulfing Pattern appears, there is no guarantee that prices will decline. Interfering factors and changes in market sentiment can impact price movements.
Overall, investors should consider the broader market context, combine other tools and analysis methods, and develop comprehensive trading decisions while observing risk management when using a Bearish Engulfing Pattern.
Uses of the Bearish Engulfing Pattern
A Bearish Engulfing Pattern typically appears in an uptrend, indicating potential price decline, but the pattern itself does not guarantee a price drop. Below are some common uses of a Bearish Engulfing Pattern:
- Trend Reversal Signal: The Bearish Engulfing Pattern is viewed as a trend reversal signal, suggesting that the uptrend may be ending and prices might start to decline. Investors can perceive it as a sell signal and consider shorting strategies.
- Confirmation Signal: The pattern often requires confirmation from other technical indicators or chart patterns. For example, combining it with trendline breaks, crucial support level breaches, or other patterns can improve the reliability of the reversal signal.
- Stop-Loss Strategy: If investors hold long positions (bullish positions), the appearance of a Bearish Engulfing Pattern can serve as a stop-loss signal. Investors can set appropriate stop-loss levels to limit potential losses.
- Counter-trend Trading: The appearance of a Bearish Engulfing Pattern can be an opportunity for counter-trend trading. Investors may consider selling assets or adopting other suitable shorting strategies.