• Home
  • Categories
  • News
  • Community
EN
EN
Home
CategoriesNewsGlossaryCommunity
Contact Us
Social Media
Region
🌏International
Region
🌏International
Revise
Contact
Home
/
Glossary
/
Head & Shoulders Top

Head & Shoulders Top

Head & Shoulders Top

Stock
Futures
Candlestick Patterns
Summary:The Head & Shoulders Top is a technical analysis pattern that typically appears before the end of an uptrend in markets such as stocks and futures, indicating a possible price reversal.

What is a Head & Shoulder Top?

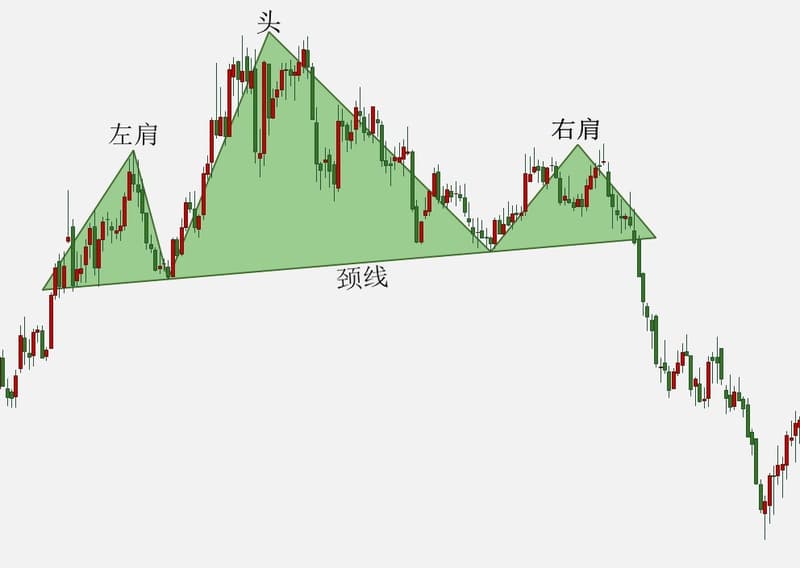
A Head & Shoulders Top is a technical analysis pattern that typically appears before the end of an upward trend in the stock or futures markets, signaling a potential reversal in price. This pattern consists of three peaks, with the middle peak (the head) being higher than the two side peaks (the left and right shoulders), which are approximately equal in height.

Head & Shoulders Top

Characteristics of a Head & Shoulders Top

As one of the common technical analysis patterns and reversal formations, the Head & Shoulders Top has the following characteristics:

  1. Reversal Pattern: Appears at the end of an upward trend, indicating a potential reversal in price or trend.
  2. Three Peaks: The middle peak (head) is higher than the two side peaks (left and right shoulders), which are approximately equal in height.
  3. Neckline: Connects the two lows between the three peaks with a horizontal line. The pattern is confirmed when the price breaks below the neckline.
  4. Measured Decline: The height from the head to the neckline represents the theoretical downward target after the neckline is broken.
  5. Time Span: The formation of the Head & Shoulders Top usually spans a long period, potentially covering several weeks or months.
  6. Volume Pattern: The volume typically decreases from left shoulder to head to right shoulder, with the left shoulder having the highest volume.

Uses of the Head & Shoulders Top

The Head & Shoulders Top is a significant technical analysis pattern used to identify a trend reversal in the market. Here are the main uses of the Head & Shoulders Top in analysis and trading:

  1. Predicting Trend Reversal: The appearance of a Head & Shoulders Top typically indicates the end of an upward trend and a potential transition to a downward trend. When the Head & Shoulders pattern is confirmed (i.e., the neckline is broken), investors can expect the market to turn downward.
  2. Establishing Short Positions: The confirmation of a Head & Shoulders Top is a signal to establish short positions. Once the pattern is confirmed, investors can consider shorting or establishing other related short positions to profit from the downtrend.
  3. Setting Stop-Loss Orders: For investors holding long positions, the appearance of a Head & Shoulders Top can serve as a signal to set stop-loss orders. Once the pattern is confirmed, investors can set stop-loss orders to prevent significant losses from a sharp price drop.
  4. Reference Price Target: Investors can use the Head & Shoulders pattern to calculate the vertical distance between the head and neckline. Once the pattern is confirmed, investors can use this measurement to predict the potential downward price target.

Risk Warning and Disclaimer

The market carries risks, and investment should be cautious. This article does not constitute personal investment advice and has not taken into account individual users' specific investment goals, financial situations, or needs. Users should consider whether any opinions, viewpoints, or conclusions in this article are suitable for their particular circumstances. Investing based on this is at one's own responsibility.

The End
Previous
Next

Related Terminology

You Missed

What is a Head & Shoulders Top? Its features? How does it differ from a Head & Shoulders Bottom?

What is a Head & Shoulders Top? Its features? How does it differ from a Head & Shoulders Bottom?

The head and shoulders is a common reversal pattern, signaling a price drop as a bull trend ends. It includes left and right shoulders, a head, and a neckline. Trading volume decreases progressively from the left shoulder to the right.

TraderKnows
TraderKnows
2024-04-29
Head & Shoulders Top
2024-04-29

Recent Post

Trump Invokes Defense Production Act with 850 Million USD for Coal Power to Meet AI Demand

9 hours ago

NY Fed Index Shows High Supply Chain Pressures as Geopolitical Conflicts Raise Global Inflation Con…

9 hours ago

Japan's Real Wages Rise for Fourth Consecutive Month, Fueling June BOJ Rate Hike Bets

9 hours ago

China Flexible Employment Exceeds 300 Million as Blue-Collar Wage Growth Outpaces White-Collar for…

9 hours ago

South Korean Stocks Post Steepest Weekly Drop Since March as Tech Valuations Reset

10 hours ago

China Commercial Paper Rates Drop in Early June Amid Rising Bank Demand

10 hours ago

UK House Prices Unexpectedly Fall in May as Geopolitical Tensions Push Up Borrowing Costs

10 hours ago

Massive Intervention Fails to Save Yen as Short Positions Surge Near Historic Lows

10 hours ago

AI Momentum Pauses as Broadcom Outlook Misses High Expectations; Markets Await Payrolls

10 hours ago

SpaceX Launches 75B USD IPO Roadshow as Access Blocked in Mainland China and Hong Kong

10 hours ago

Global Gold ETFs See $2 Billion Outflows in May as Capital Pivots to Tech Assets

10 hours ago

Nikkei Drops Over 1% on Tech Sector Pullback While Real Wage Growth Provides Support

10 hours ago

South Korea Lifts Mandatory Reporting for Crypto Transfers Over 10M Won

10 hours ago

Amundi Says Asian AI Stocks Supported by Fundamentals as Fed Path Poses Key Risk

10 hours ago

Taiwan Stocks Close 1.33% Lower on Broadcom Drop But Hold Key Technical Support

10 hours ago