What is a Candlestick Chart?
A candlestick chart, also known as a K-chart, is a graphical representation used to depict price movements in financial markets. Originating from Japanese technical analysis methods, it is widely used in markets such as stocks, futures, and forex.
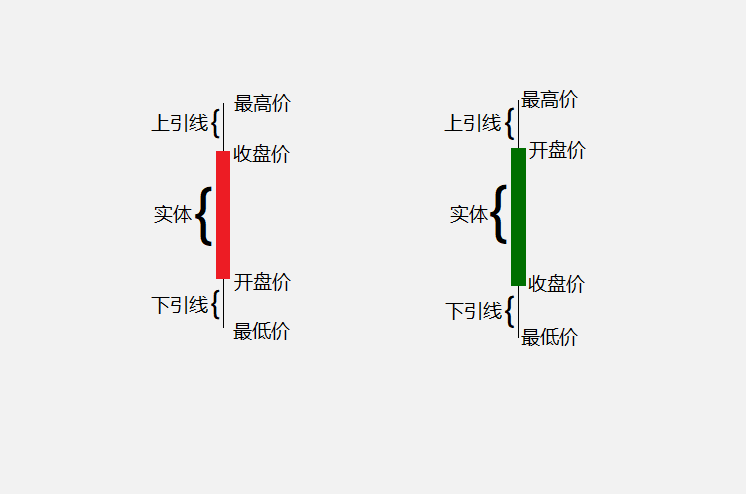
Each candlestick in a chart represents the price movement over a period (such as a day, a week, or an hour). It comprises four key prices: opening (Open), highest (High), lowest (Low), and closing (Close). The structure of the candlestick chart is as follows:
Body: The body represents the price range between the opening and closing prices. If the closing price is higher than the opening price, it is usually shown as a solid or green rectangle or bar; if the closing price is lower, it is shown as a hollow or red rectangle or bar.
Upper Shadow: The upper shadow indicates the price range between the highest price and the top of the body. It extends from the top of the body to the highest price.
Lower Shadow: The lower shadow indicates the price range between the lowest price and the bottom of the body. It extends from the bottom of the body to the lowest price.
By observing a candlestick chart, investors can grasp key information about price trends, volatility, support and resistance levels, etc. Candlestick charts can also be combined with other technical analysis tools and indicators to help predict future price movements and make trading decisions.
Candlestick charts provide a visual and powerful way to present price movements, making them widely used in technical analysis and trading decisions. By learning and understanding candlestick patterns and principles, investors can better grasp market changes and formulate corresponding investment strategies.
Common Candlestick Patterns
Candlestick charts feature many common price patterns and formations that can offer important clues about market trends and future price movements. Here are some of the common candlestick patterns:
- Long White Candle: A long, solid white real body indicating strong buying forces and rising prices.
- Long Black Candle: A long, hollow black real body indicating strong selling forces and falling prices.
- Marubozu: No upper or lower shadows; the body fully fills the range, indicating market control by either buyers or sellers.
- Bullish Engulfing Pattern: A smaller black candle is completely engulfed by a larger white candle, suggesting a continuation of the uptrend.
- Bearish Engulfing Pattern: A smaller white candle is completely engulfed by a larger black candle, suggesting a continuation of the downtrend.
- Doji: The opening and closing prices are nearly the same, forming a cross-like shape, indicating a balance of market forces and potential trend reversal.
- Hammer: A long lower shadow with a short upper shadow and small body, appearing at the bottom of a downtrend, possibly indicating a price reversal upwards.
- Hanging Man: Similar to a hammer but appearing at the top of an uptrend, possibly indicating a price reversal downwards.
- Engulfing Pattern: The second candle fully engulfs the previous day's candle, sometimes suggesting a trend reversal.
These are just a few common candlestick patterns; there are many others in the market. Understanding these patterns combined with other technical analysis tools can help investors better comprehend market trends and make more informed trading decisions. It's important to analyze candlestick patterns within the overall market context and in conjunction with other technical indicators to increase the accuracy of judgments.
Differences Between Candlestick Charts and Renko Charts
A candlestick chart is a graphical representation that uses rectangles or bars to show price movements, detailing open, high, low, and close prices. This chart provides detailed price information, visually displaying buying and selling forces and price changes. Candlestick charts are widely used in technical analysis to identify trends, patterns, support, resistance levels, and more, aiding investors in making trading decisions.
A Renko chart, on the other hand, is based on price movements and uses bricks to represent price ranges. Each brick in a Renko chart represents a fixed price range, without considering time. New bricks form only when the price exceeds the high or low of the previous brick. Renko charts mainly filter noise and display price trends, helping investors capture clearer trend signals.
While both candlestick and Renko charts represent price information, they differ in several ways:
- Representation: Candlestick charts use rectangles or bars showing open, high, low, and close prices, while Renko charts use bricks to represent price ranges.
- Time Factor: Candlestick charts are time-based, with each candlestick representing a specific time period. Renko charts ignore time factors, focusing solely on price movements.
- Price Movement Handling: Candlestick charts display absolute price values, showing price fluctuations and ranges. Renko charts divide prices into fixed ranges, showing only the direction of price changes.
- Noise Filtering: Renko charts ignore small price fluctuations, drawing bricks only when prices break specific ranges, thus filtering noise and more clearly displaying trends.
Choosing between candlestick and Renko charts depends on personal preference and trading needs. Candlestick charts provide more detailed and comprehensive price information, suitable for various technical analysis methods. Renko charts focus more on displaying price trends and filtering noise, ideal for trend traders. Regardless of the chart type, it is essential to consider other technical indicators and market factors for comprehensive analysis and judgment.