What Are Separating Lines?
Separating Lines is a continuation pattern that appears on candlestick charts, consisting of two candles of opposite colors with the same opening price. There are two types: Bullish Separating Lines and Bearish Separating Lines.
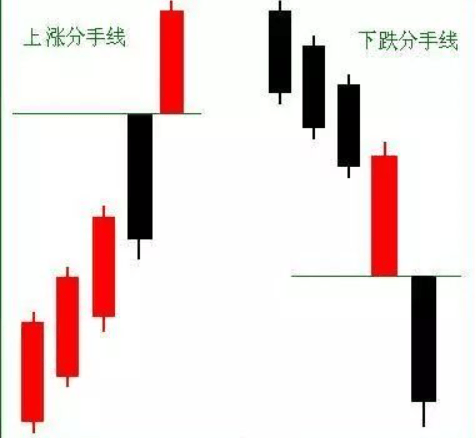
Bullish Separating Lines:
- Pattern: The first candle is bearish, followed by a bullish candle.
- Characteristics: The opening price of the first bearish candle is the same or close to the opening price of the bearish candle from the previous day, while the closing price of the second bullish candle is higher than the previous day's closing price.
- Significance: Bullish Separating Lines indicate that the bulls still have control of the market, and the upward trend may continue.
Bearish Separating Lines:
- Pattern: The first candle is bullish, followed by a bearish candle.
- Characteristics: The opening price of the first bullish candle is the same or close to the opening price of the bullish candle from the previous day, while the closing price of the second bearish candle is lower than the previous day's closing price.
- Significance: Bearish Separating Lines indicate that the bears still have control of the market, and the downward trend may continue.
Factors Affecting the Strength of Separating Lines:
The appearance of Separating Lines can signal the continuation of a trend rather than a reversal. The strength depends on several factors:
- The longer the trend continues, the stronger the Separating Lines.
- The longer the length of the two bodies, the stronger the Separating Lines.
- The smaller the volume of the first candle and the larger the volume of the second candle, the stronger the Separating Lines.
- If Separating Lines appear at critical technical breakout or support and resistance levels, their strength is greater.
- If the first candle shows a slow rise or fall and the second candle shows a rapid rise or fall, the Separating Lines are stronger.
Which Technical Indicators Can Be Used with Separating Lines?
Separating Lines themselves are just a continuation pattern, but combining them with other technical indicators can provide a more comprehensive market analysis. Here are some commonly used technical indicators that can be used with Separating Lines:
- Moving Average (MA): Moving averages help smooth price fluctuations and determine the direction of the trend. When combined with Separating Lines, you can observe whether they appear at the support or resistance level of the moving average and analyze their relationship.
- Relative Strength Index (RSI): RSI helps determine overbought and oversold conditions and the possibility of price reversals. When combined with Separating Lines, you can observe if they appear in the RSI's overbought or oversold areas and check for any divergence.
- Stochastic Oscillator (KDJ): The KDJ indicator helps determine overbought and oversold conditions and trend turning points. When combined with Separating Lines, you can observe if they appear in the KDJ's overbought or oversold areas and check for any divergence.
- Average True Range (ATR): ATR helps measure the extent of price volatility and the strength of the trend. When combined with Separating Lines, you can observe the ATR value at the time of their appearance to judge the strength of the trend and the possibility of a price breakout.
- Volume Indicators: Volume helps determine market activity and capital flow. When combined with Separating Lines, you can observe volume changes to verify the validity of the Separating Lines and gauge the market participants' intentions.