What is a Counter-Attack Line?
A counter-attack line, also known as a meeting line, is a reversal pattern in a candlestick chart composed of two candlesticks with opposite colors. The closing price of the second candlestick is the same or close to the closing price of the first candlestick. This pattern indicates that market forces have balanced, suggesting that the existing trend may pause or reverse.
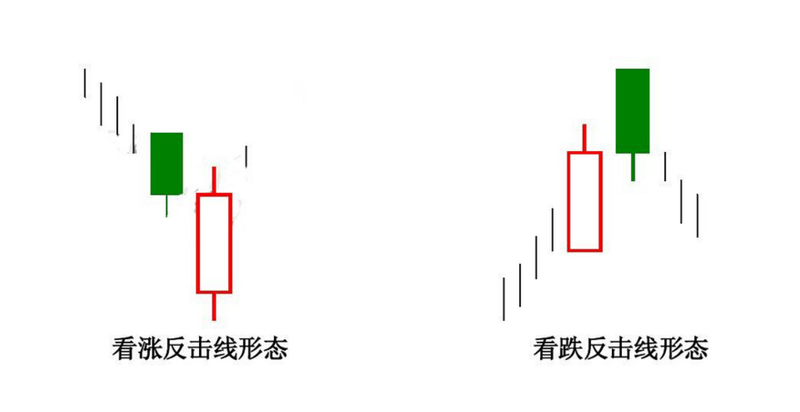
Counter-attack lines can be divided into bullish and bearish counter-attack lines. Taking a bullish counter-attack line as an example, it appears during a downtrend where the first candlestick is bearish, and the second is bullish. The opening price of the second candlestick is lower than the lowest price of the first candlestick, and the second candlestick's closing price is the same or close to the first candlestick's closing price. A bullish counter-attack line indicates that buyers have initiated a counterattack at a low point, balancing with the sellers, and this may signal a pause or reversal of the downtrend.
Conversely, a bearish counter-attack line appears during an uptrend where the first candlestick is bullish, and the second is bearish. The opening price of the second candlestick is higher than the highest price of the first candlestick, and the second candlestick's closing price is the same or close to the first candlestick's closing price. A bearish counter-attack line suggests that sellers have initiated a counterattack at a high point, balancing with the buyers, and this may signal a pause or reversal of the uptrend.
Factors Influencing the Strength of Counter-Attack Lines
The strength of a counter-attack line depends on the following factors:
- The distance between the second candlestick and the previous one: the greater the distance, the stronger the reversal signal;
- The length of the second candlestick's body: the longer the body, the stronger the reversal signal;
- The relationship of the second candlestick to the preceding and following trends: if the second candlestick appears at a critical support or resistance level and shows clear divergence or breakthrough with the preceding and following trends, the reversal signal is stronger;
- Changes in trading volume: if the second candlestick is accompanied by a significant spike in volume compared to the previous day, the reversal signal is stronger.
How to Use Counter-Attack Lines for Trading Decisions?
- A counter-attack line is a reversal signal indicating that the prevailing trend may change or temporarily pause. Therefore, traders can adjust their positions and stop-loss points based on the type and strength of the counter-attack line.
- If you see a bullish counter-attack line during a downtrend, consider buying or closing short positions, as it indicates a buying counterattack, and prices may rise. Set the stop-loss below the lowest price of the bullish counter-attack line to prevent further declines.
- If you see a bearish counter-attack line during an uptrend, consider selling or opening short positions, as it indicates a selling counterattack, and prices may fall. Set the stop-loss above the highest price of the bearish counter-attack line to prevent further rises.
- You can also use other technical indicators or charts to assess the validity and reliability of the counter-attack line, such as volume, support and resistance levels, and trend lines. Generally, if the counter-attack line appears near an important support or resistance level with significant volume, its signal is stronger.