What is the Three Methods Pattern?
The Three Methods Pattern refers to a candlestick formation where three small bullish or bearish candles appear between two larger bullish or bearish candles. This pattern indicates a temporary pause in the existing market trend, suggesting that after a period of consolidation, the price will continue along its original trend without reversing.
Types of Three Methods Pattern
Based on the trend and the meaning of the pattern, the Three Methods Pattern can be categorized into two types.
Rising Three Methods Pattern
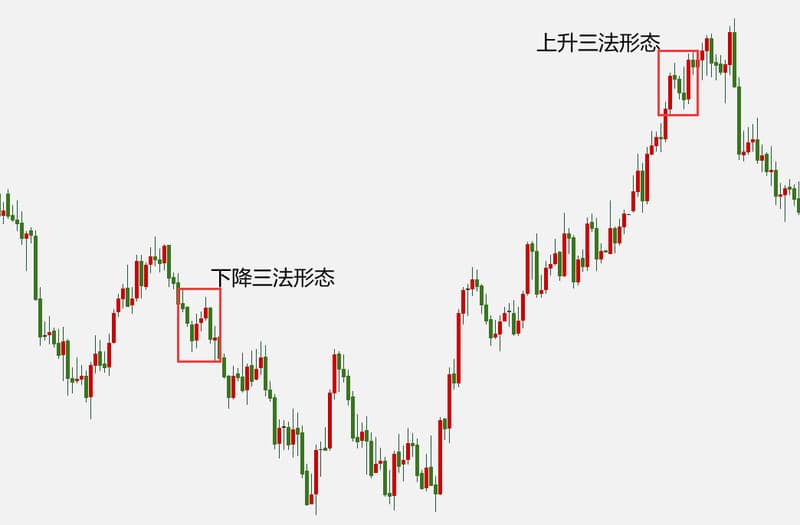
- In the Rising Three Methods Pattern, typically, after a long bullish candle, three shorter bearish candles appear consecutively, followed by another long bullish candle. This pattern commonly occurs in an uptrend and is a bullish signal, indicating that the market is in an upward phase.
- Specifically, the first long bullish candle indicates that the market is rising, while the three shorter bearish candles signify a minor pullback within the ongoing uptrend. The final long bullish candle suggests that the upward trend is strengthening, indicating that the market may continue to rise (as shown in the figure below).
Falling Three Methods Pattern
- In the Falling Three Methods Pattern, a long bearish candle is followed by three shorter bullish candles, then another long bearish candle appears.
- This pattern indicates that the market is in a downtrend. The first long bearish candle signifies a market decline, while the three short bullish candles suggest a minor rebound within the ongoing downtrend. The final long bearish candle indicates that the downward trend is strengthening, suggesting a possible continued decline (as shown in the figure above).
Characteristics of the Three Methods Pattern
The Three Methods Pattern indicates that the market has undergone a period of consolidation or adjustment, and the trend direction is likely to continue. The pattern has the following characteristics.
Rising Three Methods Pattern
- Appears in an uptrend.
- Consists of two longer bullish candles with three shorter bearish candles in between.
- This pattern indicates that buying pressure remains strong, and the market is likely to continue rising.
Falling Three Methods Pattern
- Appears in a downtrend.
- Consists of two longer bearish candles with three shorter bullish candles in between.
- This pattern indicates that selling pressure remains strong, and the market is likely to continue falling.
Uses of the Three Methods Pattern
The Three Methods Pattern is used in technical analysis to determine the continuation or reversal of a market trend and to provide trading references. Here are some common uses of the Three Methods Pattern.
- Trend Continuation Confirmation: When the market is in an established uptrend or downtrend, the occurrence of a corresponding type of Three Methods Pattern can be seen as a signal of trend continuation. For example, in an uptrend, the appearance of a Rising Three Methods Pattern may suggest that buying pressure remains strong, potentially driving prices higher.
- Trend Reversal Signal: After the market has reached a certain stage of rising or falling, the appearance of a corresponding type of Three Methods Pattern can be interpreted as a signal of trend reversal. For instance, in a downtrend, the occurrence of a Rising Three Methods Pattern might indicate weakening selling pressure, suggesting a potential upward reversal of the market.
- Entry and Exit Signals: The appearance of the Three Methods Pattern can serve as a reference for trading entry and exit points. Based on the type of pattern and its position, one can decide whether to buy or sell, and set stop-loss and profit targets.
- Combining Other Technical Indicators: The Three Methods Pattern is often used in conjunction with other technical indicators and trend confirmation tools to enhance its effectiveness. For example, combining it with moving averages, the Relative Strength Index (RSI), or other pattern analysis tools for comprehensive analysis and confirmation.