What is the Accumulation/Distribution Indicator (A/D)?
The Accumulation/Distribution Indicator (A/D) uses volume and price to assess whether an asset’s price is being accumulated or distributed. The A/D indicator aims to identify discrepancies between price and volume to reveal the strength of price trends. If the price is rising while the indicator is falling, it indicates that the buying volume may not be sufficient to support the price increase, implying a potential risk of a price decline.
Key Points
- The A/D indicator measures an asset or security's supply and demand by observing the closing position of the price within the cycle range, multiplied by the volume.
- The A/D indicator is cumulatively calculated by adding or subtracting the value from the previous cycle.
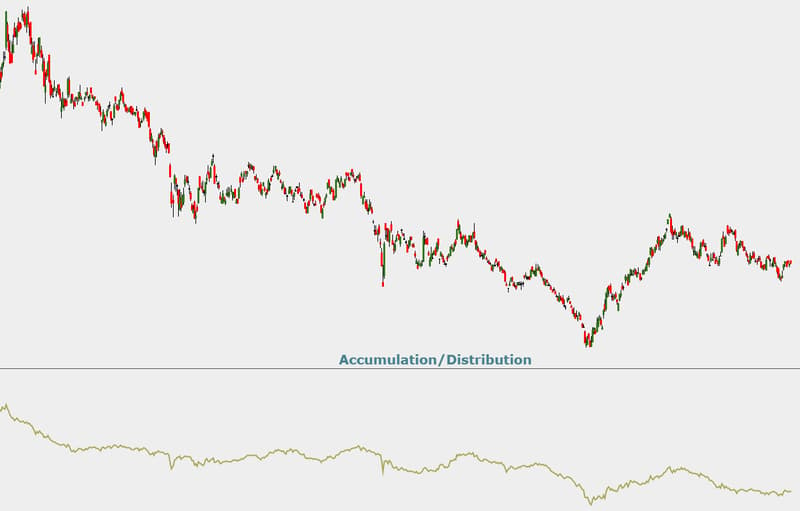
- Generally, a rising A/D indicator helps confirm an upward price trend, while a falling A/D indicator helps confirm a downward price trend.
What does the Accumulation/Distribution Indicator (A/D) Show?
The A/D indicator helps demonstrate how supply and demand factors influence prices, aligning with or diverging from price movements. Additionally, the volume and the closing position of the price within the cycle range determine the rise or fall of the A/D indicator.
The multiplier in the A/D calculation offers a standard for measuring the strength of buying or selling within a specific period. It is achieved by determining whether the price closes in the upper or lower half of its range and then multiplying by the volume. Therefore, when a stock's closing price nears the high end of the period’s range and the volume is large, the A/D indicator increases significantly. Conversely, if the price is near the high end but the volume is low, or if the volume is high but the price is closer to the middle of the range, the A/D indicator will not show a significant rise. The same concept applies when the price closes in the lower part of the oscillation range.
When analyzing price trends, the A/D indicator can potentially detect upcoming trend reversals. If the price of a security is on a downtrend while the A/D indicator is rising, it suggests possible buying pressure and a potential price reversal to an uptrend. Conversely, if the security price is trending up while the A/D indicator is falling, it indicates possible selling pressure, suggesting a potential price reversal to a downtrend.
In both scenarios, the slope of the A/D indicator offers insights into the trend. A strongly rising A/D indicator confirms a strong rising price. Similarly, if the price falls while the A/D indicator is also falling, coupled with high volume, it suggests that the price decline may continue.
Differences Between the Accumulation/Distribution Indicator (A/D) and the On-Balance Volume (OBV) Indicator
Despite their different calculation methods, both technical indicators use price and volume. The On-Balance Volume (OBV) indicator examines whether the current closing price is higher or lower than the previous closing price. If it is higher, the period’s volume is added; if it is lower, the period’s volume is subtracted. In contrast, the A/D indicator uses a multiplier based on the price’s closing position within the cycle range. Thus, these indicators provide investors with different insights by employing distinct calculation methods.
Limitations of the Accumulation/Distribution Indicator (A/D)
The A/D indicator does not consider price changes from one cycle to the next and focuses only on the closing position within the current cycle range, which may lead to some anomalies.
For instance, if a stock drops 20% with massive volume and closes near the high of the daily range yet is still 18% lower than the previous close, the A/D indicator will rise. Although the A/D indicator rises significantly and the stock closes near the high of the daily range, the stock’s price has dropped substantially. Investors need to monitor price charts and mark any potential anomalies as they may affect their judgment of future price trends.
Furthermore, another primary function of the indicator is to monitor divergence. If divergence appears between the indicator and the price, it does not necessarily suggest an imminent reversal, as it might take a long time for the price to reverse, or it might not reverse at all.
The A/D indicator is merely a tool for assessing trend strength and analyzing prices, with potential errors or misleading signals. Combining the A/D indicator with other forms of analysis, such as price action analysis, chart patterns, or fundamental analysis, can provide a comprehensive understanding of price trends.