What is a Flat Pattern?
A flat pattern is a type of chart formation in technical analysis used to describe the characteristics of price movements. It refers to a generally stable price trend on a chart, usually composed of three consecutive candlesticks. Specifically, the flat pattern has the following features:
- Candlestick Formation: The three candlesticks in a flat pattern usually have similar lengths and shapes. Their body parts (the area between the opening and closing prices) are relatively small, while the upper and lower shadows (the area between the highest and lowest prices) are longer.
- Stable Price Trend: The flat pattern indicates that market prices are relatively stable over a period, without significant upward or downward trends. This stable trend may suggest that the market is in a sideways or consolidation phase.
- Support and Resistance Levels: The flat pattern typically appears near support or resistance levels. This indicates market interest in these levels, with buying and selling forces relatively balanced.
- Reversal Signal: The flat pattern on a price chart may serve as a reversal signal. When prices form a flat pattern and then undergo a significant reversal, it may indicate a change in market sentiment, suggesting that prices may reverse direction.
It is important to note that the flat pattern is not an independent buy or sell signal; it merely describes a price trend. In practice, investors need to combine other technical indicators and chart analyses to make trading decisions and confirm further price movements.
Classification of Flat Patterns
In technical analysis, flat patterns can be classified based on their trends and shapes. Common types of flat patterns include:
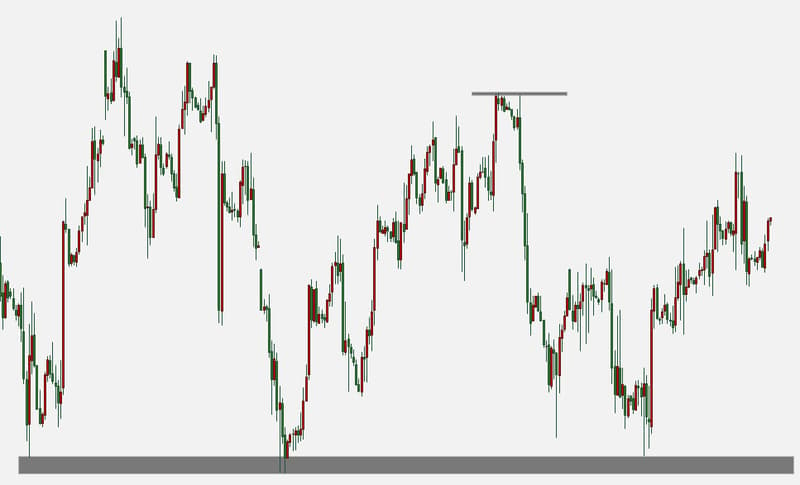
- Flat Top Pattern: This refers to a stable top level in the price trend without a significant upward trend. This pattern typically occurs when the market enters a sideways or consolidation phase, indicating that prices may reverse or decline.
- Flat Bottom Pattern: This refers to a stable bottom level in the price trend without a significant downward trend. This pattern usually occurs when the market enters a sideways or consolidation phase, suggesting that prices may reverse or rise.
- Flat Base Pattern: This refers to a stable platform or box-shaped area within a certain range of price movements. This pattern typically appears during sideways or consolidation periods, with prices oscillating within this range.
- Symmetrical Triangle: This refers to a symmetrical triangle formation in the price trend, with highs and lows gradually converging, indicating a potential large price movement upon breaking the triangle's boundary. This pattern usually signifies the market entering a sideways or consolidation phase.
- Descending Triangle: This refers to a descending triangle with a flat bottom, where lows gradually converge or remain parallel, indicating a potential further decline when the triangle's boundary is broken. This pattern typically signifies a downtrend in the market.
- Rectangle Top Pattern: This refers to a horizontal upper boundary within a certain range of price movements, forming a stable oscillation. This pattern typically indicates a sideways or consolidation phase, suggesting potential large price movements upon breaking the rectangle's upper boundary.
Uses of Flat Patterns
The flat pattern is a chart formation in technical analysis used to analyze price trends and predict potential future movements. Here are some common uses of flat patterns:
- Trend Reversal Signal: Flat patterns signal trend reversals. A flat top pattern occurs in an uptrend, indicating potential price declines, while a flat bottom pattern occurs in a downtrend, indicating potential price increases. Investors can adopt corresponding trading strategies, such as reverse positions or closing positions, once the pattern is confirmed.
- Trend Prediction: The appearance of a flat pattern can indicate that the market is entering a sideways or consolidation phase. When a flat top or flat bottom pattern appears, it suggests balanced buying and selling forces with limited price fluctuations. Investors can look for suitable entry opportunities or choose to wait.
- Breakout Trading: When the boundary line (top or bottom) of a flat pattern is broken, it may trigger significant price movements. Investors can set breakout points and confirm the continuation or reversal of trends when the price breaks the pattern's boundary, taking appropriate trading actions.
- Combining with Other Indicators: Flat patterns can be used in conjunction with other technical indicators and patterns to improve analysis accuracy. For example, combining with moving averages or the Relative Strength Index (RSI) can confirm the validity of the flat pattern and assist in determining the potential direction of price movements.